


Luna Ito-Fisher
Sensor Wrangler
In addition to editing your game footage, Trace provides you with individual performance metrics and details about how your team worked together.
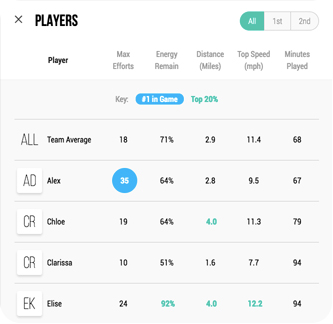
Next to the Coach Notes icon you’ll see a player icon. This will display detailed stats about all your players. Trace provides 5 player performance metrics: number of max efforts, energy remaining, distance covered, top speed, and minutes played.
Trace uses these performance metrics to rank your players. At the top of the Players tab, you’ll see the best players in every category.
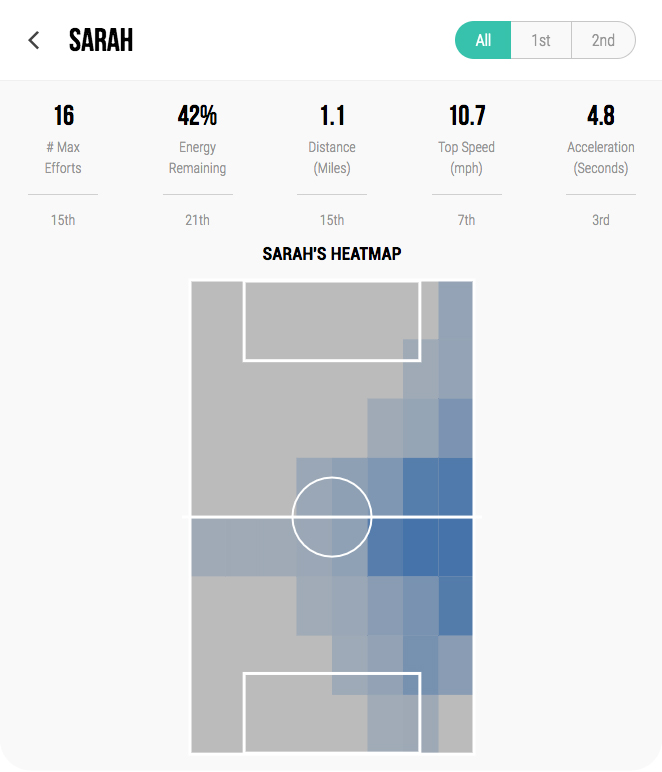
For even more detail, click on an individual player. This will show the individual’s performance metrics, how they ranked in every category, and a heat map of where they spent most of their time on the field. Heat maps can be a great tool for coaches to see if a player is spending their time effectively for their assigned position.
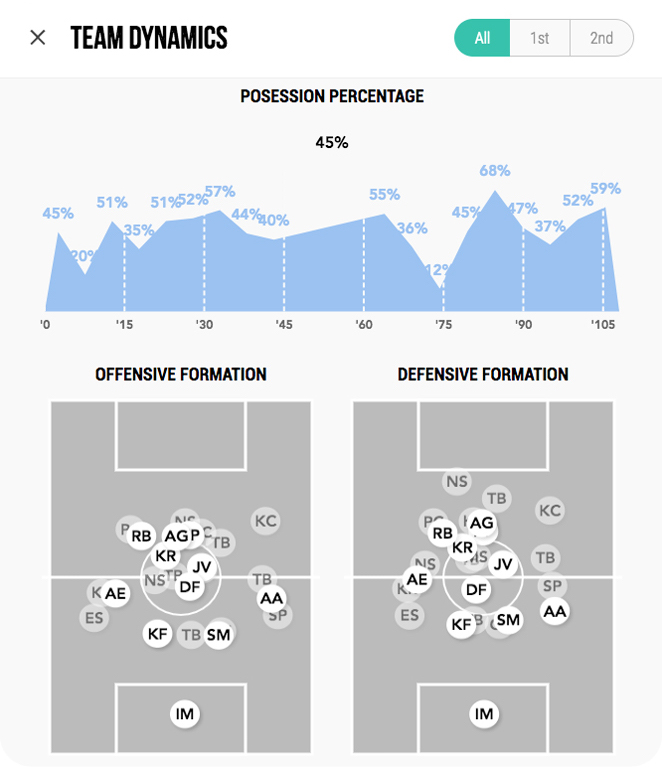
The last button in the right hand corner will take you to the Team Dynamics tab, where you can see how your team performed together. At the top there is an overall possession percentage and a graph displaying the team’s possession percentage over the course of the game. You’ll also see illustrations of where your team spent most of their time on offense and defense.
In any of the tabs, you’ll see 3 buttons in the top right corner, which read All, 1st, and 2nd. These allow you to see your results for the entire game or just the 1st or 2nd half.